


It may feel as though vintage 2025 is barely over, but grapegrowers are already likely to be making decisions regarding production for the 2025-26 season and therefore asking the question: what are the indications for next year’s grape prices?
Growers don’t have to wait for offer prices to get a good indication of the direction that prices are likely to move. There are several sources of information that can be used to get a good indication of what prices might be, or at least in which direction they are likely to move – all of them independent, free, trustworthy and relevant.
This market bulletin features one of them: the Grape Price Indicators Dashboard. For more information on the others, see the June issue of Australian & New Zealand Grapegrower & Winemaker magazine, or contact the Market Insights team at Wine Australia.
What is the Grape Price Indicators Dashboard?
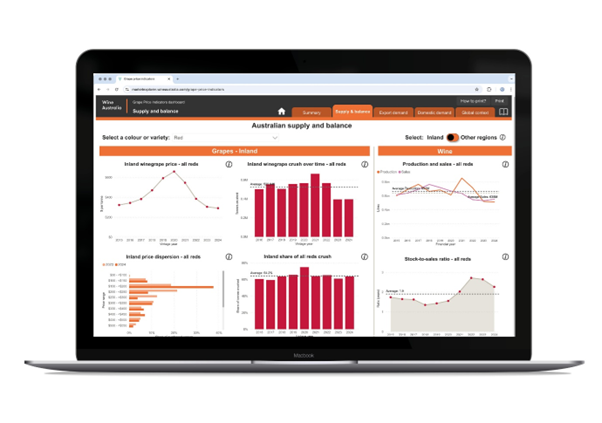
The Wine Australia Grape Price Indicators Dashboard is a free, online tool that provides a current summary of the key drivers of winegrape prices in Australian inland regions, as well as an indication of the expected direction for grape prices ahead of the next vintage.
Overall, there are 12 different sources of data all presented in one place in an easy-to-read format that allows growers to see at a glance how the indicators are trending. The dashboard can be filtered by grape colour or the major varieties, enabling growers to customise the information to be more relevant to them.
Although it is focused on grapes from the inland regions, many of the charts can be filtered for ‘other’ (non-inland) regions, or for premium vs commercial wine, so the information is relevant to a wide range of situations.
How does the dashboard help growers?
The Grape Price Indicators Dashboard allows growers to:
- Understand the market – with a clear picture of the factors influencing grape prices.
- Save time – with quick and easy access to independently-sourced, reliable and up-to-date grape price-related information all in one place.
- Negotiate with increased confidence – being able to challenge price offers that are not consistent with the market signals shown on the dashboard.
- Make informed business decisions for your business using this free resource developed with government grant money to help improve market transparency for Australian grapegrowers.
What does it all mean for prices?
Each chart has a ‘pop-up’ that tells you what it shows and how that is relevant to price. In addition, for the inland region prices only, there is an arrow on the summary page, which shows the overall indicated direction of grape prices for the next vintage based on the key indicators. This is based on an algorithm that looks at the key indicators and how they have correlated with grape prices historically.
The arrow will point ‘up’ if the model calculates that average prices will increase by at least 5 per cent compared with the previous vintage average price (for the three inland regions combined). A ‘static’ arrow means that a change of less than +/- 5 per cent is indicated, and a ‘down’ arrow indicates a decrease of at least 5 per cent.
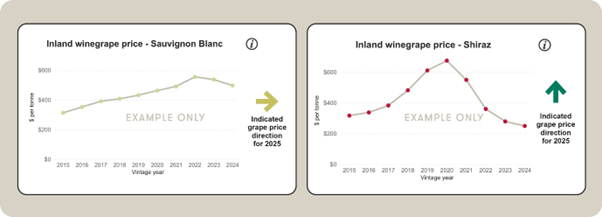
The arrow is a good reference point but may not apply to individual growers’ price offers. For example, it cannot account for non-market-driven arrangements such as:
- package negotiations where a lower price might be paid for a particular variety to compensate for taking more of, or paying a higher price for, a less-desired variety,
- prices that may be higher than the market rate but require a capped tonnage, or
- long-term contract prices that were fixed when market conditions were different.
It also cannot allow for sudden changes in market conditions, such as newly-imposed tariffs.
What are the indications saying now?
As at May 2025, the indicator arrow on the Grape Price Indicators Dashboard has just been ‘rolled over’ to 2026. Based on the combination of indicators, particularly export average values, Ciatti global bulk wine offer prices and the stock-to-sales ratio for Australian wine, the arrow is currently indicating upward pressure on grape prices for the major inland reds (Shiraz, Cabernet Sauvignon and Merlot) in 2026 compared with the average 2025 price (which, in turn, is indicated to be higher than the 2024 price). The overall red price (including other varieties) is also indicated to rise. For whites, all the major varieties (Chardonnay, Pinot Gris/Grigio and Sauvignon Blanc) are indicated to be static in 2026.
As mentioned above, when interpreting this information, it is important to bear in mind that the arrow is only based on the direct mathematical trends in the price indicators and the current values of these indicators. The underlying model will be refreshed with the latest information in July (when the average grape prices for the last vintage are known) and November (when the latest stock-to-sales ratios and sales figures are known), and the arrow updated if the indicated direction for any of the categories has changed.
While the indication of an increase in prices is a positive sign, market conditions remain difficult and demand for wine has continued to decline globally. The small projected increases may not be sufficient to exceed the cost of production, and it is unlikely that prices for Australian inland winegrapes will return to the levels of 2020 and 2021 in the near future.
Explore the Grape Price Indicators Dashboard
For assistance in using the dashboard, a ‘how-to’ video is available on the Interactive Insights page or contact the Market Insights team.

